

Yes, modern AI tools can read Windows blue screen error codes and explain the likely cause in plain English. These systems analyze crash dumps and error messages to identify hardware or software conflicts. This guide covers how crash dump analysis works and how debugging tools like WinDbg function. It also explains how AI simplifies these technical processes for everyday users. For additional details, review the .
Crash Dump Analysis
Crash dump analysis is the process of examining memory files generated when a system fails. When Windows encounters a fatal error, it writes a snapshot of the system state to a file. This file contains critical data about the drivers and processes active at the moment of failure. Understanding this data is the first step in diagnosing the root cause of a crash. For additional details, review the Customer Experience.
The Role of Windows Error Reporting
Windows Error Reporting, codenamed Watson, is a crash reporting system that collects and transmits diagnostic data. It helps Microsoft identify common issues across the user base. For individual users, the local crash dump files remain the primary source of truth for specific hardware failures. These files are typically stored in the Windows directory or a designated crash dump folder. For additional details, review the Frequently Asked Questions.
Interpreting Error Codes
Each blue screen displays a specific stop code, such as 0x00000139 or 0x0000007E. These hexadecimal codes map to specific kernel exceptions. While the code identifies the type of error, it does not always reveal the exact faulty component. AI tools excel at mapping these codes to known driver conflicts or hardware defects. They cross-reference the code with the specific modules listed in the dump file. For additional details, review the About.
Hardware vs. Software Failures
Crash dumps help distinguish between software bugs and hardware failures. Memory errors often point to faulty RAM or unstable overclocking. Driver errors usually indicate outdated or incompatible software. By analyzing the stack trace within the dump, one can identify which module was executing when the system halted. This distinction is crucial for determining whether a repair requires a software update or a physical component replacement.
WinDbg Debugging Tools
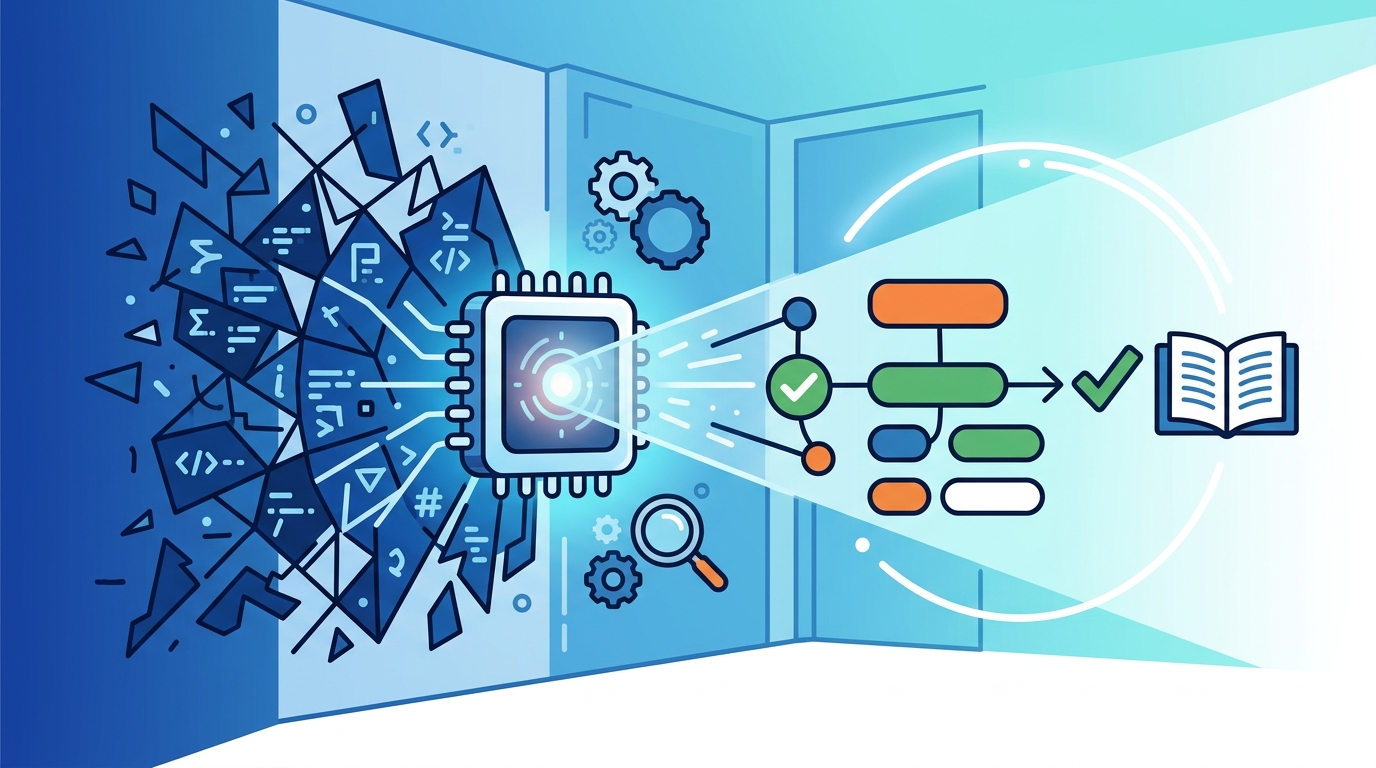
WinDbg is a powerful debugging tool provided by Microsoft for analyzing crash dumps. It is the industry standard for professional system administrators and developers. While powerful, it has a steep learning curve that can be intimidating for average users. AI assistants are increasingly integrating WinDbg logic to provide user-friendly interpretations of these complex logs.
Command Line Interface
Integration with AI Assistants
Modern AI troubleshooting platforms can ingest WinDbg output and translate it into natural language. Instead of reading raw hex addresses, users receive a summary of the likely cause. For example, an AI might state that a specific network driver caused a buffer overflow. This translation layer makes professional-grade debugging accessible to a broader audience. It bridges the gap between raw technical data and actionable repair steps.
Limitations of Automated Analysis
Automated analysis is not infallible. Complex hardware issues, such as intermittent power delivery problems, may not leave clear signatures in a crash dump. In these cases, AI tools may provide a probable cause but cannot guarantee a fix. Users should treat AI-generated diagnoses as strong leads rather than absolute certainties. Manual verification through stress testing or component swapping may still be required.
Comparison of Diagnostic Approaches
| Method | Complexity | Accuracy | Best For |
|---|---|---|---|
| Manual WinDbg | High | Very High | Developers and IT Pros |
| AI-Powered Analysis | Low | High | General Users and Enthusiasts |
| Online Code Lookup | Low | Moderate | Quick General Guidance |
Key Takeaways
- Crash dump files contain the raw memory state at the time of a system failure.
- Windows Error Reporting collects data to help identify common system-wide issues. according to Windows Error Reporting
- WinDbg is the standard tool for deep-dive analysis of crash dumps.
- AI tools can translate complex WinDbg output into plain English explanations.
- Stop codes identify the error type but not always the specific faulty component.
- Hardware failures often require physical inspection, which AI can suggest but not perform.
- Automated analysis provides strong leads but may require manual verification for intermittent issues.
- Using AI for troubleshooting reduces the barrier to entry for advanced debugging.
Frequently Asked Questions
Can AI replace a professional IT technician?
No, AI tools are diagnostic aids. They can identify likely causes and suggest fixes, but they cannot perform physical repairs or handle complex enterprise environments. They are best used to guide users toward the correct solution.
What is a stop code?
A stop code is a hexadecimal number displayed on a blue screen. It identifies the specific type of fatal error that caused the system to crash. Each code maps to a known kernel exception or driver failure.
How do I find my crash dump file?
Crash dumps are usually stored in the C:\Windows\Minidump folder. You can also check the C:\Windows\MEMORY.DMP file for a full memory dump. Ensure you have the correct permissions to access these files.
Is WinDbg free to use?
Yes, WinDbg is available for free download from the Microsoft Store. It is part of the Windows SDK and can be installed on any Windows system. No license key is required for basic debugging tasks.
Can AI read the blue screen directly from a photo?
Some AI tools can analyze images of blue screens to extract stop codes. However, reading the actual crash dump file provides much more accurate and detailed information. Photos are useful for quick identification but lack the depth of file-based analysis.
What should I do if AI suggests a driver update?
Always download drivers from the official manufacturer website. Avoid using third-party driver updater software, which can sometimes install incorrect versions. Verify the driver version and date before installing.
Does overclocking cause blue screens?
Yes, unstable overclocking is a common cause of blue screens. If you have overclocked your CPU or RAM, reset to default settings to test for stability. If the crashes stop, the overclock was too aggressive.
How often should I check for Windows updates?
Conclusion
AI technology has made it possible to decode complex Windows errors without deep technical expertise. By combining crash dump analysis with intelligent interpretation, users can quickly identify the root cause of system failures. FaultFox provides clear, step-by-step guidance to help you navigate these technical challenges. Visit FaultFox to explore more troubleshooting resources and get your system running smoothly again.