

Best Online Platforms for Diagnosing Persistent Network Dropouts
Continuous Latency Graphing
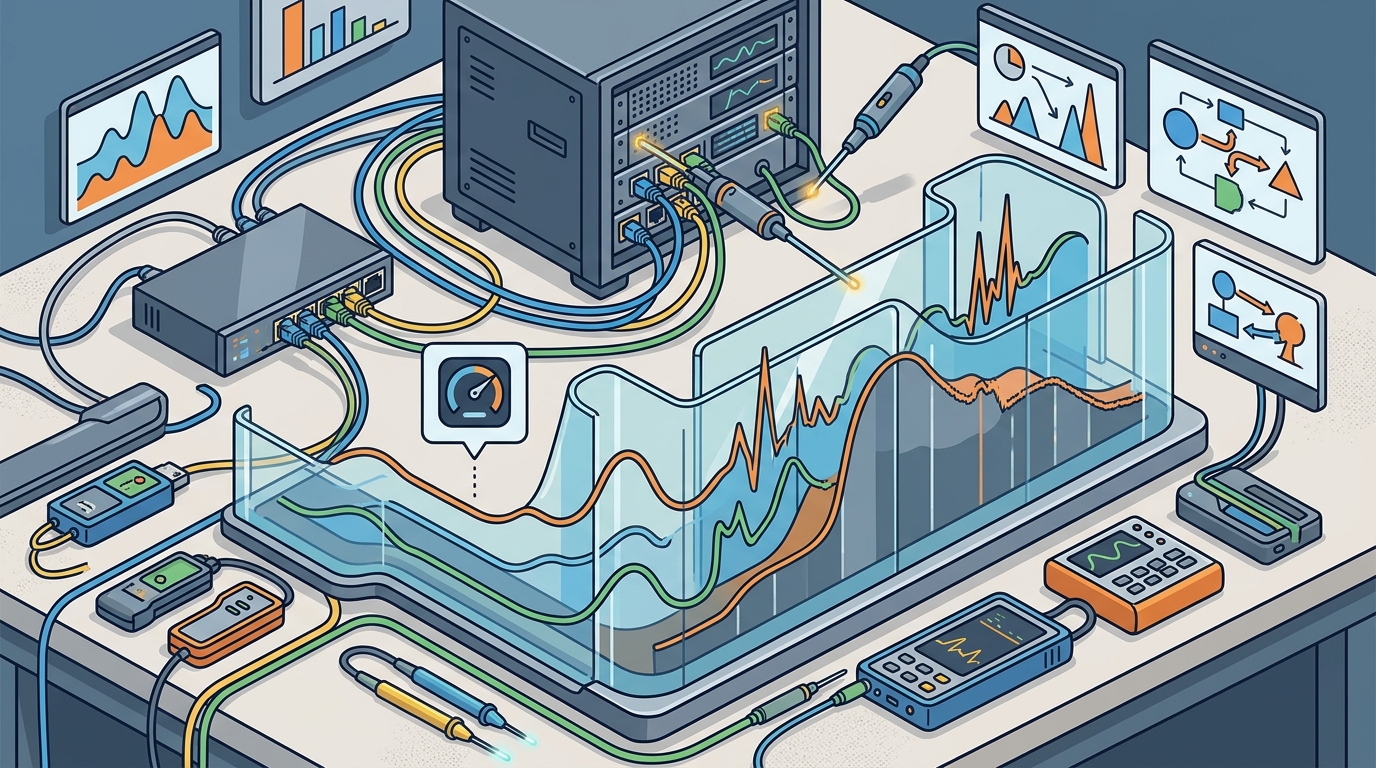
Continuous latency graphing is the process of recording the time it takes for data packets to travel from a device to a destination server over an extended period. This metric is critical for identifying intermittent issues that standard speed tests miss. A single speed test provides a snapshot, but a graph reveals patterns such as spikes, jitter, and gradual degradation. For home users, identifying whether latency spikes occur during peak hours or at random intervals helps distinguish between ISP congestion and local hardware failure. For additional details, review the Customer Experience.
Why Graphs Matter More Than Averages
Choosing the Right Graphing Platform
Not all graphing tools are created equal. Some platforms only graph latency to a single local server, while others allow users to select multiple global destinations. For diagnosing home router issues, it is essential to graph latency to both local ISP gateways and distant internet servers. If latency to the local gateway is stable but latency to distant servers is spiky, the issue likely lies with the ISP's upstream connection. If both are spiky, the local router or cabling is the probable culprit. FaultFox assists in interpreting these graphs by analyzing the data patterns and suggesting specific troubleshooting steps based on the visual evidence. For additional details, review the Frequently Asked Questions.
Packet Loss Analysis
Packet loss is the percentage of data packets that fail to reach their destination. Even small amounts of packet loss can cause noticeable dropouts in real-time applications like voice over IP or online gaming. Diagnosing packet loss requires a platform that can send a high volume of test packets and calculate the loss rate accurately over time. Unlike latency, which measures speed, packet loss measures reliability. A connection can have low latency but high packet loss, resulting in a frustratingly unstable experience. For additional details, review the About.
Interpreting Packet Loss Data
When analyzing packet loss, context is key. Packet loss during a network-wide outage is expected. However, packet loss that occurs only on a specific device or during specific times of day indicates a localized problem. Platforms that allow users to filter packet loss data by time of day or by specific destination server provide the granularity needed for diagnosis. If packet loss is consistent across all devices and all destinations, the router or the ISP connection is the likely source. If packet loss is isolated to one device, the issue is likely with that device's network adapter or Wi-Fi signal.
Automated Packet Loss Diagnostics
Router Admin Panels and Built-in Diagnostics
Key Metrics to Check in Admin Panels
When accessing a router's admin panel, users should focus on three key metrics. First, the WAN connection status, which shows whether the router is maintaining a link with the ISP. Second, the client list, which displays all connected devices and their signal strengths. Third, the system logs, which record events like DHCP assignments, connection drops, and firmware updates. A sudden drop in the WAN connection status often indicates an ISP-side issue, while a drop in a specific client's signal strength points to a Wi-Fi coverage problem.
Limitations of Built-in Tools
While router admin panels are essential, they have limitations. They typically only show data from the perspective of the router itself. They do not provide detailed information about what is happening on the ISP's side of the connection. Furthermore, the data presented is often technical and difficult for non-experts to interpret. This is where third-party diagnostic platforms and AI assistants like FaultFox add value. They can take the raw data from the router's logs and translate it into actionable steps, bridging the gap between technical data and user understanding.
ISP Provider Portals
Using ISP Portals for Diagnosis
When using an ISP portal, users should look for specific indicators of line health. Many portals display a signal-to-noise ratio or a line attenuation value. High attenuation or low signal-to-noise ratios indicate a poor physical connection between the user's home and the ISP's network. Some portals also provide historical data on connection uptime, which can help identify patterns in dropouts. By comparing the ISP's reported line health with the user's local diagnostic data, it becomes possible to pinpoint whether the fault lies with the provider or the home equipment.
When to Contact the ISP
Platform Comparison Table
| Platform Type | Primary Strength | Best For | Limitations |
|---|---|---|---|
| Continuous Graphing Tools | Visualizing latency and loss over time | Identifying patterns in intermittent dropouts | Requires manual interpretation of data |
| Router Admin Panels | Direct access to hardware status | Checking local device and connection health | Lacks ISP-side visibility |
| ISP Portals | Provider-side line quality data | Confirming or ruling out ISP issues | Lacks local network detail |
| AI Troubleshooting Assistants | Interpreting data and providing fixes | Users who need guided, step-by-step solutions | Depends on the quality of input data |
Key Takeaways
- Continuous latency graphing is more effective than single speed tests for diagnosing intermittent network dropouts.
- Packet loss analysis helps distinguish between reliability issues and speed issues.
- Router admin panels provide essential local hardware data but lack ISP-side visibility.
- Combining data from multiple platforms provides a complete picture of the network health.
- AI-driven tools like FaultFox can interpret complex diagnostic data and provide clear, actionable fixes.
- Correlating timestamps from local diagnostics with ISP outage maps helps isolate the root cause.
- Documenting specific data points, such as packet loss percentages, improves communication with ISP support.
Frequently Asked Questions
What is the best online platform for diagnosing network dropouts?
There is no single best platform, as the ideal tool depends on the specific issue. A combination of continuous graphing tools, router admin panels, and ISP portals provides the most comprehensive diagnosis. AI assistants like FaultFox can help interpret the data from these tools and guide users through the fix.
How does continuous latency graphing help diagnose dropouts?
Continuous latency graphing records latency over time, revealing patterns that single speed tests miss. Spikes in latency or sudden drops in the graph can indicate when and why the network is dropping, helping users correlate issues with specific activities or times of day.
Can I diagnose network dropouts using only my router's admin panel?
You can gather valuable local data from your router's admin panel, but it may not be enough to diagnose all issues. The admin panel shows local hardware status but does not provide visibility into the ISP's network. Combining router data with ISP portal data and external graphing tools is recommended for a complete diagnosis.
What does high packet loss indicate about my network?
High packet loss indicates that data is not reliably reaching its destination. This can be caused by a poor physical connection, a failing router, or ISP congestion. If packet loss is consistent across all devices, the issue is likely with the router or ISP. If it is isolated to one device, the issue is likely with that device.
How can FaultFox help with network troubleshooting?
FaultFox is an AI tech troubleshooting platform that helps users diagnose tech problems and follow step-by-step fixes. It can analyze data from diagnostic tools and provide clear, plain-language explanations of what the data means and what actions to take to resolve network dropouts.
Should I contact my ISP if my router shows a healthy connection?
If your router shows a healthy connection but you are still experiencing dropouts, it is worth contacting your ISP. Provide them with specific data from your diagnostic tools, such as timestamps of dropouts and packet loss percentages. This data helps them investigate the issue on their end.
What is the difference between latency and packet loss?
Latency measures the time it takes for data to travel from one point to another, while packet loss measures the percentage of data that fails to arrive. Low latency with high packet loss results in an unstable connection, while high latency with low packet loss results in a slow but stable connection.
How often should I run network diagnostics?
If you are experiencing intermittent dropouts, it is best to run continuous diagnostics in the background. This ensures that you capture data during the exact moments when the network drops. If your network is stable, running periodic speed tests and checking your router's logs is sufficient.